Tech Stock Analysis: Tesla, Sofi, Palantir, and More
Explore insights on Tesla, Sofi, Palantir, and other tech stocks. Learn about market trends, resistance levels, and breakout signals.
Investors are always on the lookout for the next big move in the stock market. This week, several tech stocks are showing interesting patterns that could indicate potential opportunities. Let's dive into the analysis of some popular stocks, including Tesla, Sofi, Palantir, and others.
Tesla (TSLA):
Tesla has been a rollercoaster for investors. Despite being down since early 2022, recent trends show a promising breakout. A breakout occurs when a stock price moves above a resistance level, which is a price point that a stock struggles to exceed. Tesla recently broke through its resistance, indicating a potential upward trend. Investors should watch how the resistance line reacts in the coming week. If it moves higher, it could signal a bullish market.
Sofi (SOFI):
Sofi has also shown a strong performance. The stock recently broke through its resistance at $11, which is a positive sign. Resistance levels are crucial as they indicate where sellers might step in. Sofi's ability to surpass this level suggests strength. However, investors should monitor the stock closely to see if it maintains this momentum.
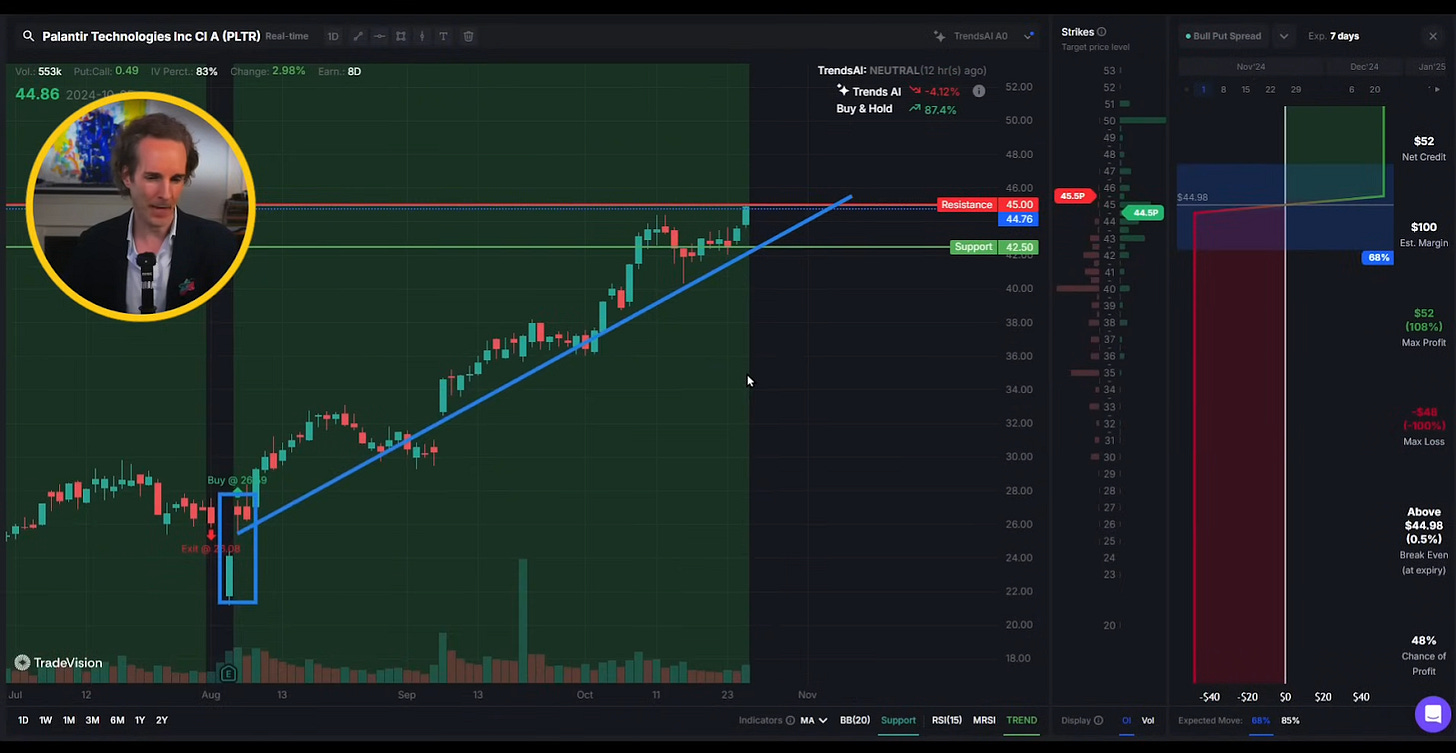
Palantir (PLTR):
Palantir has been on an upward trajectory, hitting a resistance at $45. Resistance levels can act as barriers, and breaking through them often requires significant buying pressure. While Palantir shows promise, it might not be the best entry point right now. Stocks often move in zigzags, and waiting for a pullback closer to the 50-day moving average could provide a better opportunity.
PayPal (PYPL):
PayPal has faced challenges, being down 65% since 2022. However, recent trends show a potential recovery. The stock broke through its resistance at $81, which is encouraging. Investors should keep an eye on upcoming earnings, as they could significantly impact the stock's direction.
Nvidia (NVDA):
Nvidia has been a standout performer, up significantly since 2022. The stock recently hit a resistance at $142. Investors should watch for a breakout above this level, which could indicate further gains. However, patience is key, as waiting for a better setup might yield better results.
Conclusion:
Understanding resistance levels and breakout signals is crucial for making informed investment decisions. These technical indicators can help investors identify potential entry and exit points. As always, it's important to stay informed and adapt strategies based on market conditions.
For more insights into stock trading strategies, visit Felix Prehn's Goat Academy.


